Visualization of T Cell–Dendritic Cell Encounter by Two-Photon Microscopy
Introduction
The mechanism behind allergic contact dermatitis (ACD) has been well investigated and described in dermatology textbooks. When the causative agents invade the skin, Langerhans cells (LCs) and dendritic cells recognize the invaders and capture them moving to the regional lymph nodes, which results in antigen presentation. Here, T cells become sensitized to the causative agents and proliferate in preparation for reinvasion in the future. Upon reinvasion of the agent, these sensitized T cells become activated and produce various cytokines, leading to epidermal spongiosis to wash out the invaders. This pathogenesis of ACD is well known. However, have you ever visually observed these reactions in the skin? Well, it is now possible to appreciate the visualization of ACD using two-photon microscopy
LC mobility
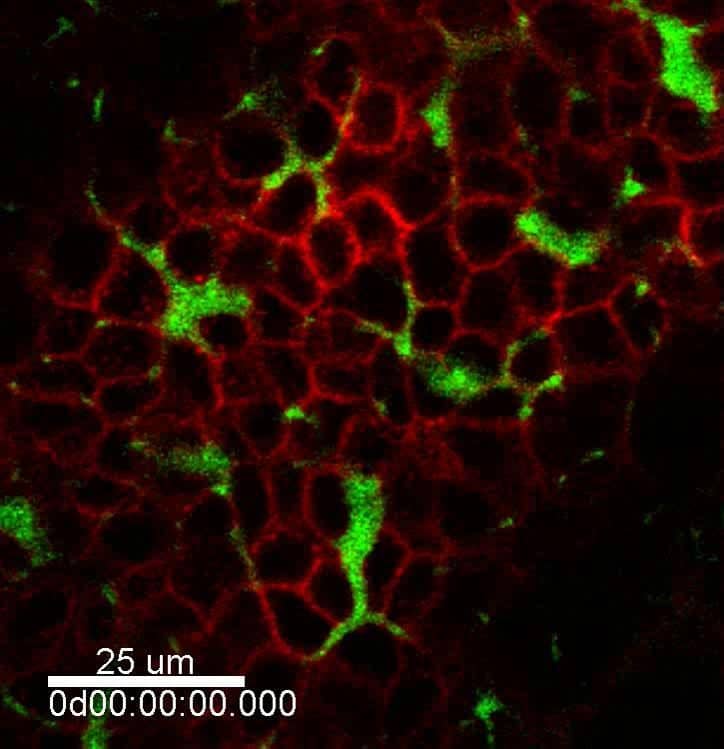
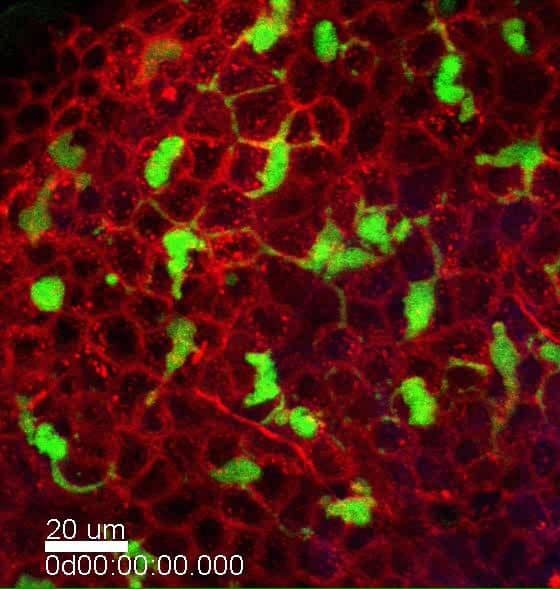
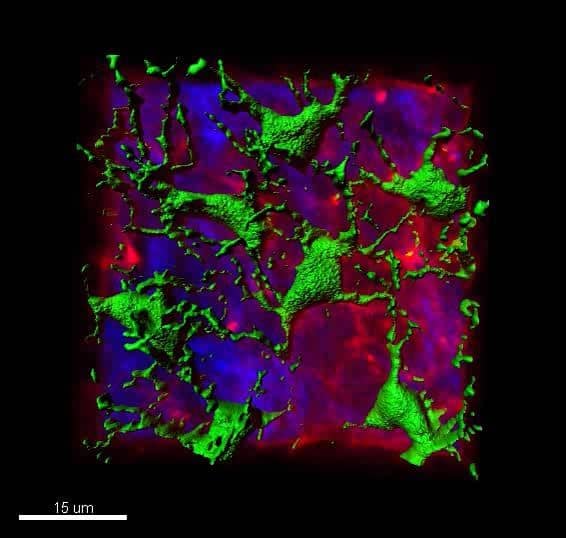
By using Langerin-enhanced green fluorescent protein mice in which LCs are stained green, we can observe the distribution and movement of LCs by TPM as shown in Figure 1a. In this image, keratinocytes are labeled red by a lectin in order to identify the location of LCs accurately. When skin inflammation is induced by topical application of an irritant, LCs start moving in the intercellular space of keratinocytes as if looking for the invaders (Figure 1b). If you look closely at these LCs in 3D (Figure 2), you will notice that they elongate their dendrites upward only, presumably in order to capture the invaders entering from outside of the skin; not from the inside.
LCs rendezvous with T cells in lymph nodes
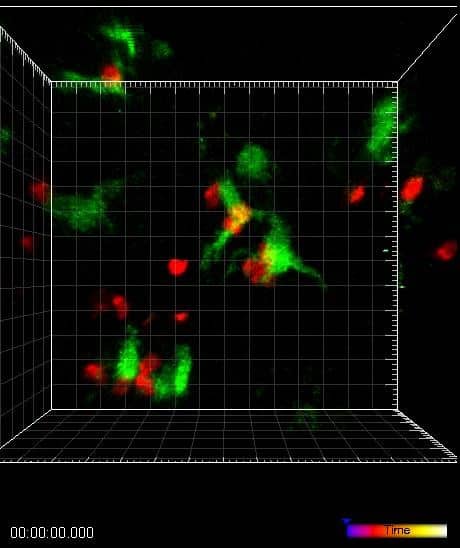
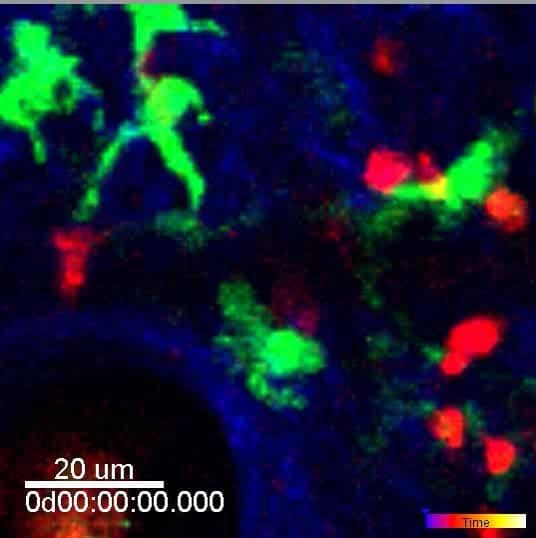
As shown in Figure 3, LCs (green) demonstrate close contact with T cells (red) for a while in lymph nodes, suggesting some information may be exchanged here. It is unclear whether antigen presentations occur; however, one may infer that this meaningful rendezvous is of great importance for contact sensitization. Further studies are required to uncover this mysterious encounter.
Live imaging of T cells in both irritant and allergic contact dermatitis
Figure 4 shows live-image movies of T cells in both steady state (a) and inflammation (b). Under no stimulation, we hardly observe T cell movement in the mouse ear skin; though T cells occasionally appear like shooting stars. Upon phorbol myristate acetate application to induce irritant cutaneous inflammation, both CD4 T cells (green) and CD8 T cells (red) begin moving around smoothly in the skin.
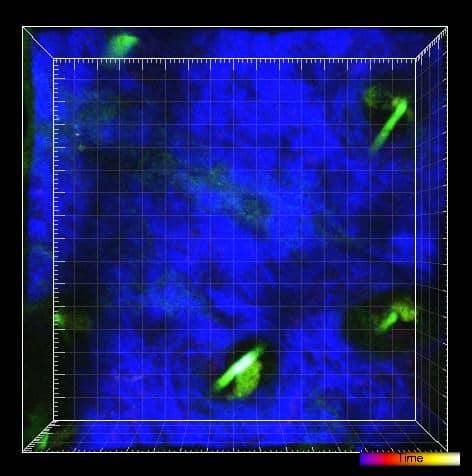
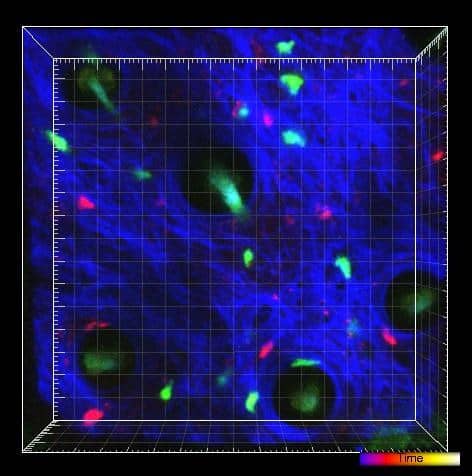
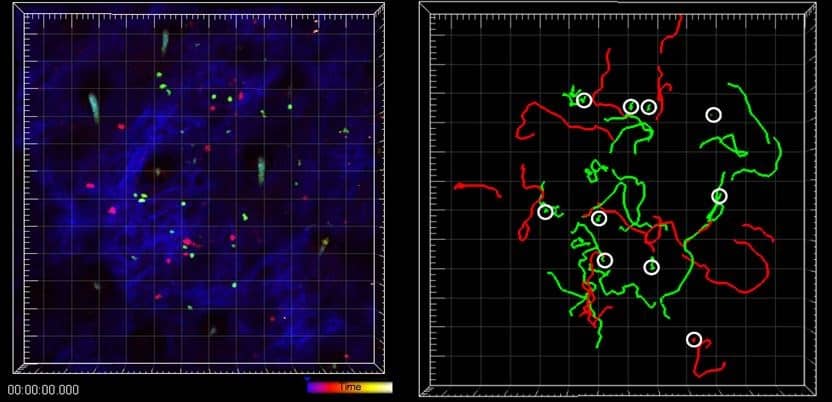
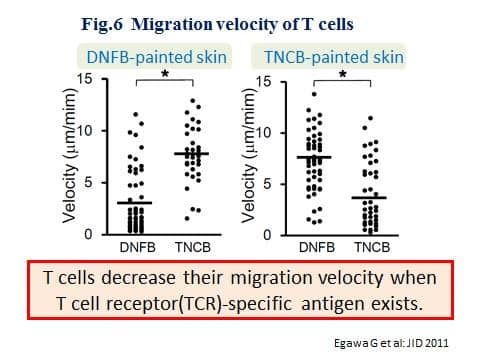
Figure 5 demonstrates T cell behavior in dinitrofluorobenzene (DNFB)-painted ear skin in DNFB-sensitized mice. DNFB-sensitized T cells were labeled green and trinitrochlorobenzene (TNCB)-sensitized T cells were labeled red. In these movies, it is possible to observe some DNFB-sensitized T cells (green) stop migration for more than an hour (denoted by white circles in the right-hand panel). Conversely, most TNCB-sensitized T cells (red) moved actively. If the migration velocity of T cells is measured (Figure 6), DNCB-sensitized T cells demonstrate reduced velocity in DNFB-painted skin, but not in TNCB-painted skin, and vice versa. This suggests that T cells decrease their migration velocity when T cell receptor-specific antigen exists.2
Dendritic cells' encounter with sensitized T cells in the skin in the elicitation phase of contact dermatitis
During the elicitation phase of ACD, by painting DNFB in DNFB-sensitized mouse skin, it seems likely that T cells stop moving in the vicinity of dendritic cells for a while (Figure 7), suggesting that the encounter of these two cell populations occurs in the elicited skin. Although it still remains unclear what kind of communications are exchanged here, we speculate that there is a very good chance of antigen presentation in the skin.
Conclusion
Thanks to the new technology of TPM, the immunological response of contact dermatitis can now be visualized as real-time movies, which demonstrate the behaviors of both T cells and dendritic cells. By following the footsteps of contact sensitization as well as elicitation visually, we can appreciate the skin as an important immunological organ. More precise visual analysis of the process will reveal how immunological musicians play in the orchestra on the stage of the skin.